This tip explains how to use a web browsers to help diagnose issues with published objects and/or panoramas.
Contents
Accessing the Error Console
Most web browsers have a built-in error console or developer tools which may need to be activated before use. Below lists some of the more popular browsers and how to access the tools.
Safari
To access the error console in Safari, the Developer Mode must be activated first.
Mac OS X
- Open Safari and choose Safari > Preferences > Advanced. Then select Show Develop menu in menu bar.
- Choose Develop > Show Error Console.
- Close the console by clicking the close button on the left hand side of the error consoles menu bar.
Windows
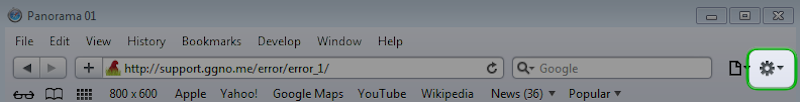
- Open Safari and click Settings (highlighted below) > Preferences… > Advanced. Then select Show Develop menu in menu bar..

- To show the menu bar, click Settings > Show Menu Bar. The menu bar can be removed at any point by clicking Settings > Hide Menu Bar.
- To use the console, open Safari and in the menu bar choose Develop > Show Error Console.
- Close the console by clicking the close button on the right hand side of the error consoles menu bar.
Firefox
Firefox comes with its own built-in web console.
Mac OS X
- Open Firefox and choose Tools > Web Developer > Web Console.
- Refresh the web page.
- Close the console by clicking the Close button on the left hand side of the error consoles menu bar.
Windows
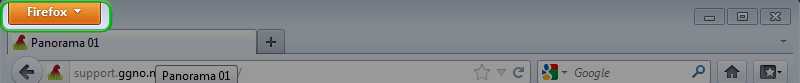
- Open Firefox then click on the Firefox drop-down menu.

- Choose Web Developer > Web Console.
- To close the Console click the Close button found on the right hand side of the Consoles menu bar.
◊ TIP: There is a powerful add-on for Firefox called Firebug, this enhances the console and makes finding faults easier. In the video above, in the second error example which used a back slash, Firebug actually shows the back slash as well as displaying the URL encoding of it.
Chrome
Google Chrome calls its error console, Developer Tools.
Mac OS X
There are a few ways to access the Developer Tools.
- From the menu bar choose View > Developer > Developer Tools. Make sure Console is highlighted then refresh the webpage.

- Open Chrome then click Customize > Tools > Developer Tools. (To close the Developer Tools click the Close button found on the left hand side of the Developer Tools menu.)

Windows
- Open Google Chrome and choose Customize > Tools > Developer Tools.
- To close the Developer Tools click the Close button found on the right hand side of the Developer Tools menu.
Internet Explorer
Internet Explorer calls their error console, Developer Tools. Unlike the other web browsers, Internet Explorer cannot detect what is happening in the Flash player so you will not get any errors. It is recommended that you use one of the other browsers for error hunting. However, it is still useful for other diagnostic reasons.
- Click Tools > F12 developer tools. The Tools button is located the right of the address bar.

- To close the developer tools click the Close button on the right in the developer tools menu.

Using the Error Console
To show the consoles working here are three links each with an error.
- Error_1 does not have its javascript file (swfobject.js) uploaded to the server, so the SWF cannot be displayed.
- Error_2 has a subfolder called, pano, that contains the SWF. The file path is using a backslash instead of a forward slash.
- Error_3 has a simple capitalization error.
Error_1 opened with Safari on Mac
When the Error Console is first opened, make sure Console and All are selected in the console’s menu bar. It is also recommended to refresh the page.

This looks as if Adobe Flash is not installed, but the console is showing it can not find the file, swfobject.js on the server.
Error_2 opened with Firefox on the PC
The page will open without an error, so click the hotspot and the console will show the error as it tries to open the next panorama.

The above image is showing that rather than a forward slash (/) between the file names, it has %5C which is the URL encoding for a backslash (). So, in the Hotspot Editor the wrong slash was used.
Error_3 opened with Google Chrome on the Mac
This panorama worked before uploading to the server.

The above image is showing that when the point hotspot was clicked the panoramas did not change and an error was displayed. When clicked, the point hotspot wass looking for Pano_02.swf. However, on the server the file is pano_02.swf. When tested locally hotspots are not case sensitive, even running through the web server, but once uploaded they are.
See also
Safari Developer Tools
Google Chrome Developer Tools: Console
Firefox Error Console
w:Url_encoding